Catalogue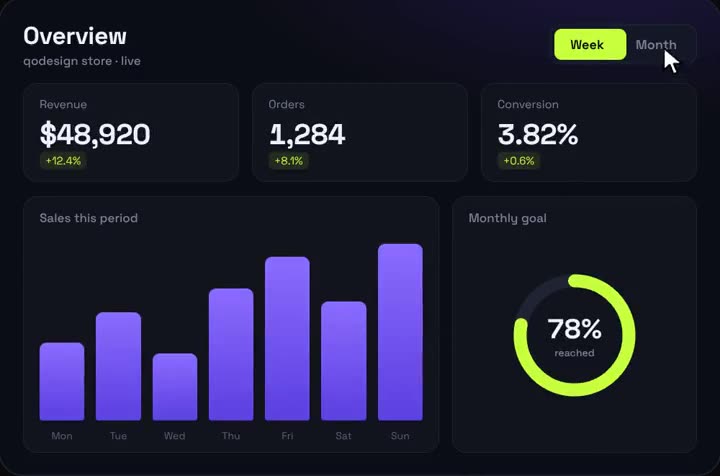
KPI numbers count up with easing, the bar chart springs in with a stagger, bars show tooltips on hover, the goal ring fills, and a Week/Month switch with a sliding pill animates everything to the new data.
What it does
- Animated KPI counters
- Spring bar chart with hover tooltips
- Goal ring + Week/Month switch
- HTML/CSS/JS + React (Vite, TS, Tailwind, Framer Motion)
- PROMPT.md for AI coding agents
- Stack
- React · Tailwind CSS · Framer Motion
- Reel keyword
- DASH, if you came from Instagram
- Released
- Licence
- Personal and client projects. Licence
Analytics Dashboard V1
$9