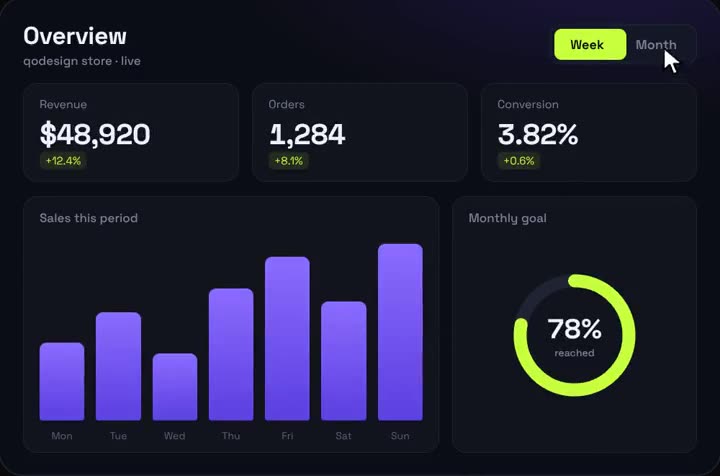
Animated analytics dashboard
A dark dashboard where every number counts up and the charts draw in.
Use it in Next.js
"use client";
import { AnalyticsDashboard } from "@/components/AnalyticsDashboard";

export default function Page() {
  return <AnalyticsDashboard title="Revenue" data={myData} />;
}
Install
- Copy from the zipPut
react/src/componentsintosrc/, thennpm i framer-motion. - Or ask your AIPaste PROMPT.md into Cursor, Lovable or v0.
Props
- data
- your KPIs and series
- title / subtitle
- header text
- startDelay
- ms before the count-up
Questions
Does the dashboard work in Next.js?
Yes, as a client component. Keep "use client" at the top of the file that renders it, as in the snippet above. App Router and Pages Router both work.
Can I plug in my own data?
Yes. Pass data with your numbers; the sample data shows the shape.
Can Cursor or v0 add it for me?
Yes. Each download has a PROMPT.md. Paste it into Cursor, Lovable, v0 or Claude Code and it fits the piece into your app.
Can I use it in client work?
Yes, in personal and client projects. You can't resell the code itself as a kit.